Monday, March 4, 2024

Final Breakthrough

 Finally, managed to create an intra-day trading system that combined both trend and mean-revert strategies and the orders won't hit each other :D and the profits are aggregate of the strategies trade individually.  

The most important thing is that the system has much lower (about half) risk (max dd) while the aggregate profit is being kept.

Yes, it is possible :D

Cheers and Happy Trading!


Monday, January 27, 2020

Intraday Trading: Why You Need Trading API and The Pros and Cons of API Trading


Intraday trading is the question I get asked most and here I would like to address some of the main challenges.

Trading API allows traders the ability to build their own trading applications and consist of many portions; market data (real-time & historical), order and trade management, portfolio and account status updates.  In this post, I am going to talk about market data access API.

If you do quant trading (for non-direct exchange access traders), especially intraday, either structured time series or unstructured market microstructure analysis, you will at the very least need to use API provided by your broker for market data. Why?  Protecting your "trade secret" of course!

Although during the trading methodology analysis phase (back-test + optimization) to come up with profitable & robust trading strategy, you can do without API (just download or buy market data from legitimate source), how are you going to implement it during active market?  How and where are you going to get the, say 5-minute OHLCV bar or bid/ask/last done price and volume in real-time so that your strategy can analyse and then provide real-time trading signals?

To solve this problem, you have 2 choices:

1    1.       Pull method (for structured/fixed time-series only).

You could either manually (less complicated) or setup a fixed interval timer (more error handling routines needed) to call the API that provides the time series data that you needed in real-time.  The pro for this method is that it is relatively easy to implement.  The cons are that there will be a few seconds delay between you initiate the call and until you receive the data completely.  You will also be subjected by your API provider on throttling rules (too many complicated rules to discuss in this post) to avoid over stressing their servers.  Imagine a runaway program calling the API every second or worst!

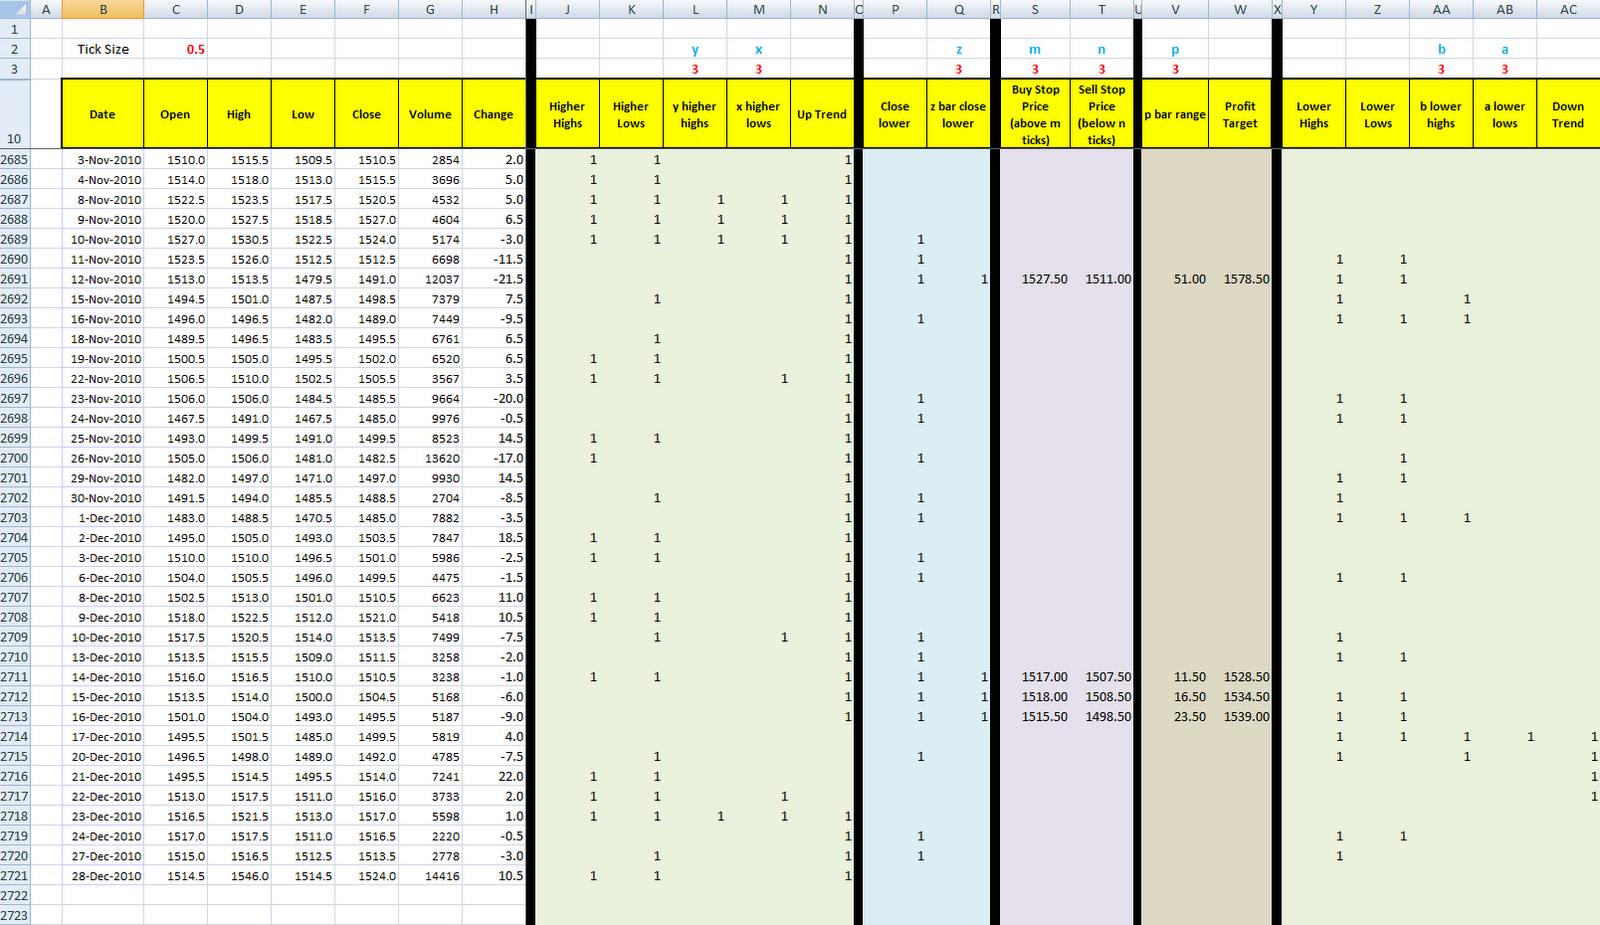
For practitioners, there is another very important thing of concern; the availability of in-progress bar (see image below) and the delay (from the time it happened until you receive it).  Your strategy will have to differentiate between completed bars and in-progress bar.  If the API doesn’t provide you in-progress bar, then you could have a big problem, prices could run wild during the in-progress x-minute bar and you would miss your trade setups and signals depending on your trading strategy.

The best solution, with almost no delay, for time series data is to use the stream method explain below, however I have yet to come across any API that streams x-minute interval OHLCV in real-time, with in-progress and completed bar solution!  That would be on top of my wish list.


 2.        Push/stream method (for tick data, well, almost).

This is the best method in theory but not in practice.  If the API provides you with real-time every tick data, plus the changes of bid/ask, then this is the best method to use.  However, in practice, there is just too much data to process and push over internet!  So, most API only provide a snapshot of the real-time data, for Interactive Brokers at the moment it is a 250ms snapshot.  The pro for this method in theory is that you could build your own time-series (see image below) in almost real-time (rarely more than 1 second delay) and have your own trading strategy that choose any interval that no one compete with.  You could also do your own unstructured time analysis for your own HFT strategy.

However, in practice, not only it is much harder to implement and much more computer resource intensive, due to the snapshot, you would miss some of the prices done at and the order flow.  That means you cannot trust almost every setups and signals generated as the OHLC prices you captured and processed may not be accurate!  Another problem is that when the market is hot, the servers will push/stream the market data much slower (sometimes up to a few seconds) than when the market is calm.  Furthermore, how do you recover when the servers are disconnected then reconnect due to various reasons?

The last problem is a current problem.  Prices done by internal matching (internalization) doesn’t seem to send through the API!!!  Sometimes that would mean a few ticks missing or even seems like trade through the best bid/offer. I have personally observed trades done up to 6-7 ticks away!


To sum it up, like it or hate it, you will have to implement your intraday trading system using the trading API provided by your broker one day.  Some of the pros and cons of pull or push methods are provided above, no perfect solution exists, just choose one that fits your trading strategy, skill set and resources.  For me, I run both at the same time for each trading strategy (on different instances of Excel, both DDE & RTD).

Cheers and Happy trading!

Thursday, December 5, 2019

On the Divergence of Return Between L&I ETF & Its Underlying Product


Long time readers of mine know that I like to use picture to highlight my point, here's the specific scenario to clearly show the divergence of return if the path of return is followed.


Under the hypothetical scenario, it shows that even if the index return 10%, the 2x Leverage ETF loss 17.5% !
That is why L&I ETF is not meant for long term buy-and-hold strategy.  Just remember that.

Cheers and Happy trading!

Monday, December 2, 2019

Leveraged and Inverse ETFs (L&I ETFs)


A long-time local blog follower of mine who is also a retail stock market investor/trader told me he is very excited about the launched of L&I ETFs locally and asked me what should he watch out for. 

I guess after have been following the L&I ETF in US market since 2006, the number one question I always get asked by even experience traders is “how come I am correct in my forecast that the underlying index was up after 1 year but my leveraged ETF still lose money?”

For those of my readers who are too lazy to read the risk disclosure in the 99-page master prospectus please be warn of the high probability of divergence of the return of the underlying index and the L&I ETF! 

The daily return target of the L&I ETFs means that it is not meant for long-term buy and hold strategy (I am lazy to explain how volatility, compounding effect and path dependency affect the divergence of returns).  Otherwise you will join the many investors who ask the same question again after losing money even being correct in their forecast/prediction.

Cheers & Happy Trading !

Sunday, April 7, 2019

The Science of Trading


A lot of people ask me about the scope of "The Science of Trading", here's my simple version, still work in progress, enjoy!


Sunday, October 20, 2013

Goal / Target Setting and Performance Measurement for Futures Trading


What is the reasonable goal or target of expected return we need to set for ourselves to make taking the higher risk in futures trading worthwhile ?  Everyone has got their own numbers.  How do we grade ourselves?  Everyone has their own way as well.  I'm going to share a quick and dirty way here.

First, we use the leverage in the product that we are trading to set the goal or target of expected return.  Let's take FCPO for example:

The settlement on Friday for most active month (Jan14) was 2401.  Contract multiplier is 25 and the margin (both initial and maintenance) at the moment is RM4500. 

Leverage = actual contract size / initial margin
                = (2401 x 25) / 4500
                = 13.34
Let's round  it to 13.

If we take risk-free rate here as our BNM's OPR at 3% now, then the expected return (goal / target) we should be looking at for taking the risk to speculate in FCPO should be 13 x 3% which is 39% per annum!  Of course that is the ideal target or 100 marks equivalent in our exams.  In actual trading we won't be putting up just the exact initial margin but maybe 2 to 3 times more per contract.  If your trading rules is to put up 2 x the required margin then your expected return would be lower down by half to 19.5% per annum as the leverage is lower by half.  Putting 3x margin would lower down your target to 13% return per annum.  Of course with position sizing algorithm, your return should be higher.  The example shown here is pure basic 1 contract. 

As you can see if your system needs RM30,000 to trade a contract, your expected return becomes 6% which may not be that attractive anymore.  This will be a quick guide for you to search or develop a trading system that gives you a favourable reward to risk ratio.

How do we measure our own performance?  Quick and dirty way would be the same way we grade in exams.  If 50 points is the equivalent of making 3% (risk-free rate) or just pass then we need 80 points and above to get A.  If we use 2x margin per contract, you would need a return of (0.6 x (19.5-3) + 3) = 12.9% and above per annum to get an A!  Of course statistics shown that most traders would get an F which is losing money!  Trading would be one of the most challenging subjects in life to get an A year after year, let alone trying to be an outstanding student which is to beat the target every year.

That's my quick and dirty way to set the target and do self performance measurement in futures trading.  Cheers & Happy Trading!

Sunday, October 6, 2013

Blind Faith or Calculated Risk? How Many Consecutive Losses to Expect?


A lot of system traders when develop or looking for a trading system would only want a high win rate or high percentage of winning trades (other than high return) thinking that that is the most important thing and will minimise their losses or drawdowns when trading it.  I am here to tell you not necessary!

Having a high win rate doesn't mean you will never suffer many consecutive losses (which I'll talk about here) or even the trading system will make money in the long term (I'll explain more maybe in future article)! 

But how do I know how many consecutive losses to expect?   I'll show you a quick Excel spreadsheet that I hope would help some traders understand trading edge better.  The example below shows a system with 70% win rate in a 10,000 permutation simulation with their respective numbers and percentage of consecutive win and loss trades.  How many consecutive losses is the maximum in this sample of simulation? 9!!!  Multiply that with your average size of losing trade and you'll roughly get the idea of how much minimum starting capital needed in the trading system (plus margin for the number of lots you are trading if you don't want margin call or intraday force liquidation of your positions). 

How do you know if you'll start with consecutive winnings first or consecutive losses first?  Now who tells you luck is not important in system trading?  Lets say you have bad luck, imagine 6 months to go through max consecutive losses when you start then another 6 months trying to climb back to breakeven, that is 1 full year of pain, I can't blame you from giving up on system trading.

Even a system with 70% win rate you may suffer 9 losses in a row!  What if during actual trading, the win rate drops to 60%? Will your ratio of average win/average loss big enough to still have positive edge? Or the system will go into losses or stop working which is what usually happened as the win rate that we get is usually fully optimised, a drop in win rate when trading live is almost for sure!  What about usual trend-follow system with 30-40% win rate?  Can you still take the next trade after suffer 8th consecutive losses?  Will telling yourself "fear is not real" help??? Talk is always easy.

Here's the sample screen:


Cheers & Happy Trading!

P.S.:  How many max consecutive losses for a system that is 50%?  Ever wonder why it is more common than what we expect to see 15 consecutive "big" or "small" in Genting or any Casino?  That is why doubling down after losses will never work in the long run.  Money management will not help if your edge or average trade is negative!

Wednesday, December 29, 2010

Programming Chart Pattern in Excel - Part 3

                             
Here's the updated screen shot that anonymous requested.  The first one shows the short in 2008 and the second one shows the long in around mid this year. 

Please also take note that this is consider cherry pick and I am in no way promoting these trading rules.  Run the back-test and optimize the parameters on your own before even consider trading it.


Cheers & Happy trading!
                                     

Programming Chart Pattern in Excel - Part 2

                                                  
As expected, Excel realised the "strangeness" in the output on my previous post.  I realised the ambiguity in the rules given when I did the programming to let beginners know that when writing your algo, you can't assume that the programmer can use common sense to fill in the blanks left by the rules, it has to be clear and precise otherwise it will be GIGO (garbage in, garbage out).

To make some sense out of the rules given, here's my interpretation of the blanks being left out (in addition to the updates given by Excel that I've missed as it went into SPAM's tab) and the output from the updated version.

1.  The z bar lower close compare to z-1 happen while market is in uptrend (y continuous higher highs AND x continuous lower lows).
2.  Market is considered to be in uptrend until they are in down trend (b continuous lower highs AND a continuous  lower lows) and vice versa.
3.  Buy-stop order instead of buy (that's is just my mistake on typing the order type, I assume that you know it is a buy-stop order when the buy price is much higher, I am sorry, thanks for the correction, Excel)
4.  You could define different parameters for up trend and down trend, although you have to be careful on the long or short bias in your system when you use different values, usually it is consider bad if one side is easier to be fulfilled than the other.  You would have trouble when there is a regime or paradigm shift.  I hope you understand what I mean :).

Here's the updated screen (done in <10 min):


Oh yes, one more thing Excel, I am sorry that I am lazy to do the charts since the numbers already speaks to me :) and personally I think this could be further improved to be a good trend-following system. 

Cheers & Happy Trading!
                      

Tuesday, December 28, 2010

Programming Chart Pattern in Excel - Part 1

                                             
In response to Excel's comment on my previous blog, here's the screen capture (graphical requested by Excel) of the rules (programmed in MS Excel using only in-cell formulas) given by Excel on the comment section on my previous post.

This is the ouput from  < 30 minutes of programming.  I am sure it can be further improved.


All the parameters in red color can be changed and calculations will be updated automatically!

Just do the reverse for Sell and plug-in your modules for back-testing and you are set to begin optimizations(since you already have the Buy/Long, Stop-loss and Profit target price)!

Cheers & Happy Trading !
                                   

Friday, July 23, 2010

Verifying Historical Volatility Calculation

              
This article was written for you, Bryan.

Since you brought up the question of whether volatility is an arbitrary value in your comment on my previous article, I've been curious to find out if I am still half as good as I was a few years back :) .  Since most of the files I did last time were lost, I spent many hours trying to find and finally managed to dig out an annualized 30 day historical volatility of KLCI from 2001-2006 that I've downloaded from Bloomberg (industry standard other than Reuters) last time.

The first thing I did was to plug-in the KLCI index value into the Excel that I've created to calculate the volatility of FCPO and put Bloomberg's data side by side to compare.  Then I tried to find the period that has been used by Bloomberg to calculate the annualized 30 day historical volatility. 

After a few trial and error, I managed to get the same exact value of KLCI's annualized 30 day historical volatility value with Bloomberg.  Bloomberg uses 260 days instead of 252 trading days in a year.

As usual, the screen capture is as below:


Cheers & Happy trading!
                                          

Tuesday, July 20, 2010

FCPO Volatility Measurement

         
Since I've heard a lot of people talking about how hard it is to trade our FCPO these days because of the high volatility, I've decided to do some facts checking of my own.  To have our own view in the ocean of opinions surrounding us every day that could influence and cloud our judgment is the first step towards becoming a good systems developer.

Since every subjective statement is relative, I've written a simple Excel spreadsheet to measure and compare FCPO's volatility since end of 2006 until first week of July 2010 and see if it is true that recent volatility is higher than average between this period.

Since most of the trend-following systems are using daily data, I've decided to use the daily closing price (unadjusted though) to measure the annualized monthly volatility.  I don't wish to go into the detail definition of volatility measurement as you can easily google and read them.  Okay, okay, I know you are lazy, here's a quick definition I copied from Wikipedia : Volatility refers to the standard deviation of the continuously compounded returns of a financial instrument within a specific time horizon.

As usual, a picture is worth more than a thousand words...

As usual, surprise!  FCPO's volatility recently is the lowest in about 4 years that I've measured!
              
If you believe that low volatility means that market tends to be in cycles more than trend, then naturally a trend-following system would be going through the usual drawdown, how bad the drawdown is just a function of balance between risk and reward that you choose. 

As usual, too aggressive and you'll have higher probability of reaching maximum drawdown that you are able to stomach, too conservative and the return may not justify trading in futures market.  Again as usual, there is no one size fit all solution because everyone is different!  That is why trading is always challenging and interesting!   Cheers & Happy trading!


Tuesday, June 15, 2010

Evaluating Trading Returns

                                         
Too often when beginners are evaluating and comparing systems' performances, the first and only thing that is on their mind is they want to see and compare which has the highest % of return only.  In my opinion, that could be quite dangerous. 

Remember that nothing is really free in this world, when you see a system that has a very high % of return, the next few things you should look at (other than at least total trades of more than 50 has been generated) is how much startup capital was used to get that % of return?  What is the Maximum (Open & Close) Drawdown as a % of the startup capital used?  What is the Standard Deviation of trades as a % of startup capital used?  Can you verify the performance yourself?

In short, the % of return is only meaningful when you look at the risk at the same time.  They are the different sides of a same coin!

To show you what I meant, I have two different performance summary for you to compare and choose.  If you love high % of return alone, you would probably choose the first one.  However, if you have lower risk appetite and don't mind a bit lower % of return, you would probably choose the second one, if you have to choose one.

The 1st one...
            
The 2nd one...


Actually both of them are quite similar, its just that the high % of return for the 1st one is due to much lower startup capital being used compared to the 2nd one.  If you can stomach drawdown of more than 90% or you always think that you are the lucky one and would always escape that drawdown when you start trading, then by all means go for the higher % of return one.  If you can stomach only maximum drawdown of about 30-40% , then you may want to consider the 2nd one, if you have to choose between the two.  Cheers & happy trading!


Disclaimer: Taken from CFTC RULE 4.41 – HYPOTHETICAL OR SIMULATED PERFORMANCE RESULTS HAVE CERTAIN LIMITATIONS. UNLIKE AN ACTUAL PERFORMANCE RECORD, SIMULATED RESULTS DO NOT REPRESENT ACTUAL TRADING. ALSO, SINCE THE TRADES HAVE NOT BEEN EXECUTED, THE RESULTS MAY HAVE UNDER OR OVER COMPENSATED FOR THE IMPACT, IF ANY, OF CERTAIN MARKET FACTORS, SUCH AS LACK OF LIQUIDITY. SIMULATED TRADING PROGRAMS IN GENERAL ARE ALSO SUBJECT TO THE FACT THAT THEY ARE DESIGNED WITH THE BENEFIT OF HINDSIGHT. NO REPRESENTATION IS BEING MADE THAT ANY ACCOUNT WILL OR IS LIKELY TO ACHIEVE PROFIT OR LOSSES SIMILAR TO THOSE SHOWN.

AND

WHATEVER YOU READ HERE SHOULD BE USED AS LEARNING AIDS ONLY AND SHOULD NOT BE CONSTRUED AS INVESTMENT ADVICE. IF YOU DECIDE TO INVEST REAL MONEY, ALL TRADING DECISIONS ARE YOUR OWN RESPONSIBILITY.


Wednesday, May 12, 2010

My View On Systematic Trading

     
I received an email from "Blurrturtle" that asked "What are your rules for system trading?"

When I first got this email, I was thinking whether this is a trick question.  System's trading by definition is already trading with a set of rules.  So naturally I was wondering if "Blurrturtle" wanted the set of rules in my trading system or just basic guideline on systematic trading.  I believe he/she meant the second part.

Novice trader may be wondering, why are there so many rules to systematic trading?  First you have a set of rules that govern what, where, when and how you trade, then you have another set of rules to make sure that you follow the previous set of rules!  I'll try to explain why in my future postings.

Here's my simple set of rules for systematic traders:
1. Do proper back-testing and optimization.  Make sure you know your systems performance well then ask yourself if you are comfortable with the max drawdown (usually it will happend sooner and bigger than you think) and how long it takes to recover? If not, don't trade the system or find another one.
2. Make sure you have sufficient startup capital (identified via your back-testing) before start trading.
3. Have in place a method to tell you that you should stop trading the system when it is no longer working.
4. Just strictly follow your system (without fighting with yourself and the market) until 3 happens.  This is usually the hardest part.

I hope that answers the question posted by "Blurrturtle".  Cheers & Happy trading.
        

Friday, November 6, 2009

S&P 500 Index Futures - Result (If Go Live Since 2009)

                           
Since only one person actually did the live test and post the answer after about a week, I might as well give you all the simple answer.

Anonymous is correct, if we use the same strategy and trade live since the beginning of this year (2009), we would have a profit of USD 3,877.50 (trading only 1 contract each time).  Out of 25 trades made, 16 or 64% is profitable with an average trade or expectancy of USD 155.10 and a profit factor of 1.53.  Not fantastic but not too bad either.

Here's the screen for the beginning of the year:


And here's the latest trade until yesterday 5th Nov 2009:


Disclaimer: Taken from CFTC RULE 4.41 – HYPOTHETICAL OR SIMULATED PERFORMANCE RESULTS HAVE CERTAIN LIMITATIONS. UNLIKE AN ACTUAL PERFORMANCE RECORD, SIMULATED RESULTS DO NOT REPRESENT ACTUAL TRADING. ALSO, SINCE THE TRADES HAVE NOT BEEN EXECUTED, THE RESULTS MAY HAVE UNDER OR OVER COMPENSATED FOR THE IMPACT, IF ANY, OF CERTAIN MARKET FACTORS, SUCH AS LACK OF LIQUIDITY. SIMULATED TRADING PROGRAMS IN GENERAL ARE ALSO SUBJECT TO THE FACT THAT THEY ARE DESIGNED WITH THE BENEFIT OF HINDSIGHT. NO REPRESENTATION IS BEING MADE THAT ANY ACCOUNT WILL OR IS LIKELY TO ACHIEVE PROFIT OR LOSSES SIMILAR TO THOSE SHOWN.


AND

WHATEVER YOU READ HERE SHOULD BE USED AS LEARNING AIDS ONLY AND SHOULD NOT BE CONSTRUED AS INVESTMENT ADVICE. IF YOU DECIDE TO INVEST REAL MONEY, ALL TRADING DECISIONS ARE YOUR OWN RESPONSIBILITY.
                                               

Wednesday, October 28, 2009

Out-of-Sample Back-test Result

                              
If you have done your exercise, you would have got the result which looks similar to the screen below:


Not too bad, although not as good as the in-sample test, the out-of-sample test shows a profit of 633 points or USD 15,825.00 before transaction cost. You should be able to program it in by now.

If you have put in a little more effort, you would have found out that the number of winning trades is 111 and the number of losing trades is 59 which give us a winning percentage of 65.29% and a losing percentage of 34.71%. As usual, if the winning percentage is high you’ll have to sacrifice with a bit lower average winning per trades; here it is 19.8 points against -26.5 for average losing per trades.

The average per trade or expectancy of the strategy on S&P 500 index futures (2003-2008) is USD93.09 (before transaction cost). The profit factor would be 1.40. Not that fantastic on the out-of-sample test but what if we were to go live trading using it since the beginning of 2009 until now? Can anyone tell me whether it makes or loses money?


Disclaimer: Taken from CFTC RULE 4.41 – HYPOTHETICAL OR SIMULATED PERFORMANCE RESULTS HAVE CERTAIN LIMITATIONS. UNLIKE AN ACTUAL PERFORMANCE RECORD, SIMULATED RESULTS DO NOT REPRESENT ACTUAL TRADING. ALSO, SINCE THE TRADES HAVE NOT BEEN EXECUTED, THE RESULTS MAY HAVE UNDER OR OVER COMPENSATED FOR THE IMPACT, IF ANY, OF CERTAIN MARKET FACTORS, SUCH AS LACK OF LIQUIDITY. SIMULATED TRADING PROGRAMS IN GENERAL ARE ALSO SUBJECT TO THE FACT THAT THEY ARE DESIGNED WITH THE BENEFIT OF HINDSIGHT. NO REPRESENTATION IS BEING MADE THAT ANY ACCOUNT WILL OR IS LIKELY TO ACHIEVE PROFIT OR LOSSES SIMILAR TO THOSE SHOWN.


AND

WHATEVER YOU READ HERE SHOULD BE USED AS LEARNING AIDS ONLY AND SHOULD NOT BE CONSTRUED AS INVESTMENT ADVICE. IF YOU DECIDE TO INVEST REAL MONEY, ALL TRADING DECISIONS ARE YOUR OWN RESPONSIBILITY.
                              

Tuesday, October 27, 2009

Trading Strategy Refinement

                             
So far we have completed the step 8 of the whole process of design, develop and built a simple trading system and I used SMA (5) crossover SMA (10) as an example. You now actually have a simple trading and back-testing system already! All you need to do is to expand the system, continue to read more and build and test more trading strategies until you have found one that you are comfortable and have confident trading in.

If you have done the earlier exercise and completed the simple back-test system, you would have noticed that the SMA (5) crossover SMA (10) actually lose quite a lot of money on S&P 500 index futures! That is the reason why I want to use the S&P 500 as an example for our exercise. The screen shot of the bottom portion of the completed basic system is here:


Does it mean that the simple moving average crossover strategy cannot be used? One simple way you can try and find out is to change the periods in the SMA crossover that we used e.g. SMA (5) x SMA (15) and step through each time with fixed increment and see the results! I know, that means a lot of work. Some of the commercial software can do the stepping automatically and it is normally meant for the professionals. That would reinforce the concept that nothing is really free in this world as well as time is money!

Another interesting way (which is the focus of my using of S&P 500 index futures as an example) to sometimes accidentally find your trading strategy is when you back-test a strategy that you thought should work but turn out to be a loser, you can inverse it to make it a trading strategy! For example in this case we could inverse the SMA (5) crossover SMA (10) and turn it into counter-trend strategy or trend fading strategy.

Let’s try to change the rules and reverse the buy and sell. Here’s the screen shot of the in-sample.


As predicted, we now have a winner on SMA (10) crossover SMA (5) counter trend strategy on our in-sample. What do you think the strategy will fare against the out-of-sample? This is your exercise again. I will post the result on my next article. Happy trading and good luck!
          

Disclaimer: Taken from CFTC RULE 4.41 – HYPOTHETICAL OR SIMULATED PERFORMANCE RESULTS HAVE CERTAIN LIMITATIONS. UNLIKE AN ACTUAL PERFORMANCE RECORD, SIMULATED RESULTS DO NOT REPRESENT ACTUAL TRADING. ALSO, SINCE THE TRADES HAVE NOT BEEN EXECUTED, THE RESULTS MAY HAVE UNDER OR OVER COMPENSATED FOR THE IMPACT, IF ANY, OF CERTAIN MARKET FACTORS, SUCH AS LACK OF LIQUIDITY. SIMULATED TRADING PROGRAMS IN GENERAL ARE ALSO SUBJECT TO THE FACT THAT THEY ARE DESIGNED WITH THE BENEFIT OF HINDSIGHT. NO REPRESENTATION IS BEING MADE THAT ANY ACCOUNT WILL OR IS LIKELY TO ACHIEVE PROFIT OR LOSSES SIMILAR TO THOSE SHOWN.

AND

WHATEVER YOU READ HERE SHOULD BE USED AS LEARNING AIDS ONLY AND SHOULD NOT BE CONSTRUED AS INVESTMENT ADVICE. IF YOU DECIDE TO INVEST REAL MONEY, ALL TRADING DECISIONS ARE YOUR OWN RESPONSIBILITY.
                                                        

Monday, October 26, 2009

Designing and Developing a Simple Trading System – Part 5

                               
In this article, I’ll show you how to complete the rest of the fields of our basic trading and back-test system that I use as an example.  You can expand the columns and start adding in things that you wish to calculate later on.   

Click and select cell S2 then type in Open Position

Click and select cell S12 then type in =IF($N12<>"","L",IF($Q12<>"","S",S11)) click and drag the lower right corner of the cell and fill the rest of the rows.

Click and select cell T2 then type in Entry Price

Click and select cell T12 then type in =IF($N12<>"",N12,IF($Q12<>"",Q12,T11)) click and drag the lower right corner of the cell and fill the rest of the rows.

Now you will have a column showing your open position as well as the entry price of your open position.

To start calculating the profit and loss of each trade as well as the cumulative profit and loss, first click and select cell V2 then type in Profit / Loss

Click and select cell V13 then type in =IF(S12<>S13,IF(S12="L",T13-T12,T12-T13),"") click and drag the lower right corner of the cell and fill the rest of the rows.

Click and select cell W2 then type in Cumulative P/L

Click and select cell W11 then type in 0

Click and select cell W12 then type in =IF(V12<>"",V12+W11,W11) click and drag the lower right corner of the cell and fill the rest of the rows.

The last column is fairly easy; I’ll leave it as an exercise for you. If you can’t finish it, that means your interest and passion is still not enough, maybe trading is not suitable for you yet.

If you manage to finish it, you’ll realize something important which I’ll explain in my next post. Happy trading and good luck.

Oh, I’ve forgot, the screen should look something like this: