Wednesday, September 30, 2009

Profitable Bollinger Bands Strategy - Trend-following (Breakout Entry)

I have shown that trading counter-trend using standard settings in Bollinger Bands is a good way to lose money in FKLI in previous post.  Now I'll reverse the strategy into a trend-following (breakout entry)  instead.  If my backtesting program is correct, the gross profit and gross loss should be the opposite of the counter-trend result, and therefore should be profitable.

Here is the performance summary:


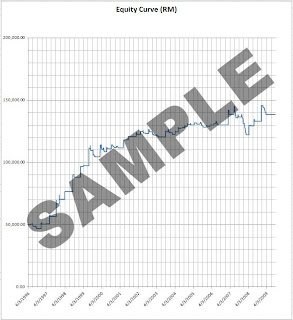
and the equity curve (before cost) chart.


You can see from the report that it is indeed a profitable strategy (although not really impressive) and the equity curve chart is the reverse of the counter-trend chart. 

In fact from the performance summary report you can also know the minimum capital needed to sustain the maximum unrealised drawdown and still be able to trade at 100% margin according to the margin of RM5K(just top up whatever amount if you think that the highest possible margin is higher than the one here).  It also shows the average annual return if you decide to go with that minimum capital. 

I would suggest a much higher capital as it is very hard to stomach a drawdown of over 50% considering you need a return of 100% at that stage just to get back to your starting capital.  The usual rule is the percentage of maximum unrealised drawdown over starting capital of not more than 30% as the worst trades will always be ahead of you.  Even with all this you can never be certain that you will survive as the future performance is always unknown.

With some simple optimization, I am sure a better parameter with smaller drawdowns and higer system expectancy would be found.  Just make sure the sample (in-sample as well as out-sample) data that you test on contain all the different market cycles of bulls, bears and sideways market.  You just need to find a trade-off that matches with your own risk appetite.


Disclaimer: Taken from CFTC RULE 4.41 – HYPOTHETICAL OR SIMULATED PERFORMANCE RESULTS HAVE CERTAIN LIMITATIONS. UNLIKE AN ACTUAL PERFORMANCE RECORD, SIMULATED RESULTS DO NOT REPRESENT ACTUAL TRADING. ALSO, SINCE THE TRADES HAVE NOT BEEN EXECUTED, THE RESULTS MAY HAVE UNDER OR OVER COMPENSATED FOR THE IMPACT, IF ANY, OF CERTAIN MARKET FACTORS, SUCH AS LACK OF LIQUIDITY. SIMULATED TRADING PROGRAMS IN GENERAL ARE ALSO SUBJECT TO THE FACT THAT THEY ARE DESIGNED WITH THE BENEFIT OF HINDSIGHT. NO REPRESENTATION IS BEING MADE THAT ANY ACCOUNT WILL OR IS LIKELY TO ACHIEVE PROFIT OR LOSSES SIMILAR TO THOSE SHOWN.


AND


WHATEVER YOU READ HERE SHOULD BE USED AS LEARNING AIDS ONLY AND SHOULD NOT BE CONSTRUED AS INVESTMENT ADVICE. IF YOU DECIDE TO INVEST REAL MONEY, ALL TRADING DECISIONS ARE YOUR OWN RESPONSIBILITY.  
 

Bollinger Bands Counter-trend Strategy - Continue

    
Here's the performance summary report for Bollinger Bands strategy described in my earlier post, backtested on Bursa FKLI from Jan 1996 - Sep 2009 (continuous front-month EOD data without adjustment). 


and here is the equity curve (before cost) chart.


It surprises me again.  The strategy lose money big time!  It contradicts with my observation on daily charts that the prices seem to bounce between lower and upper Bollinger Bands. It even challenges the statistical notion that prices tend to fluctuate between 2 standard deviation (should be about 95% of the price movements) from the average moving price of the past x periods.  However, all is not lost, it also means that the reverse should be profitable meaning using it as a trend-following strategy instead of a reversal or counter-trend strategy. 

The question is, how much risk we'll have to take and what is the minimum capital to start in order to reduce the chances of blowing up our account before reaching the expected profit (maximum adverse excursion)?  I'll discuss and post some of the systems based on Bollinger Bands in my future postings. 

For now, I'll leave you with one question to ponder.  How do we verify that if a performance summary is good then the strategy really work?  Couldn't it be profitable just by luck or chance only?  In short, how do we trust the backtest result?

Hints on my future postings:  What is the problem with this advice that I kept overheard a broker gave to his clients; it goes roughly like this "The market is ranging, when it is ranging you should quickly take profit already...".  This is how I always evaluate every advice given by the so call pros--IS IT IMPLEMENTABLE MONEY MAKING ADVICE?  It doesn't matter whether the advice make sense or not, as sometimes money making advice counter our logic at first but works nevertheless.  As I have shown, even strategies that seems so logical, and is being advised by so many pros proved to be losing money.  Go ahead, take your best shots.


Disclaimer: Taken from CFTC RULE 4.41 – HYPOTHETICAL OR SIMULATED PERFORMANCE RESULTS HAVE CERTAIN LIMITATIONS. UNLIKE AN ACTUAL PERFORMANCE RECORD, SIMULATED RESULTS DO NOT REPRESENT ACTUAL TRADING. ALSO, SINCE THE TRADES HAVE NOT BEEN EXECUTED, THE RESULTS MAY HAVE UNDER OR OVER COMPENSATED FOR THE IMPACT, IF ANY, OF CERTAIN MARKET FACTORS, SUCH AS LACK OF LIQUIDITY. SIMULATED TRADING PROGRAMS IN GENERAL ARE ALSO SUBJECT TO THE FACT THAT THEY ARE DESIGNED WITH THE BENEFIT OF HINDSIGHT. NO REPRESENTATION IS BEING MADE THAT ANY ACCOUNT WILL OR IS LIKELY TO ACHIEVE PROFIT OR LOSSES SIMILAR TO THOSE SHOWN.

AND

WHATEVER YOU READ HERE SHOULD BE USED AS LEARNING AIDS ONLY AND SHOULD NOT BE CONSTRUED AS INVESTMENT ADVICE. IF YOU DECIDE TO INVEST REAL MONEY, ALL TRADING DECISIONS ARE YOUR OWN RESPONSIBILITY.
      

Tuesday, September 29, 2009

Bollinger Bands - Counter-trend Strategy

Today, I overheard an interesting advice given by a broker to his client which goes somewhat like this "...sometimes you can also use Bollinger Band to sell when the price goes up above the upper line, then buy back when it goes to the lower line, short also can make money, long also can make money one, the price sometimes go up down up down one..." 

The conversation inspires me to detour again.  Hmmm... counter-trend trading.  I'll put Bollinger Bands to the test on my next posting.  What does your gut feel tell you?  Do you thing go Long when the price of FKLI penetrates lower Bollinger Bands and then turn Short (reversal trade) when it penetrates upper band (default setting--BB20,2) using EOD FKLI from 1996 - 2009 will make you good money?  We shall see...

Quite A Surprise (Again) on RSI !

I recall a friend/trader who is very obsessed with RSI (Relative Strength Index).  Everytime when we talk he would ask "what is the RSI on this date?", "what is the RSI on that date?" followed by his usual remark "ohhh, that's why it drop lah.." or "aha, that's why it goes up..".  For this friend of mine, I've put aside donchian style breakout in favor of RSI in this and subsequent post.

A very quick intro to RSI.  It is an oscillator which measures the relative strenght of the movement of prices.  Please google the rest on your own.  It can be programmed in excel as well, in my opinion, not as easy as MACD.

This time I do a backtest using RSI(14) using a very common strategy and default settings: go Long when RSI(14) crosses from below to above 30 (oversold), go Short when RSI(14) crosses from above to below 70 (overbought).  It is a Stop-and-Reverse(SAR) system where you square Long and turn Short at the same time and vice-versa.   The data used - Bursa FKLI continuous front-month EOD contract from Jan 1996 - Sep 2009.  Moeny management: basic 1 contract, SAR.

Heres the result...


And the equity curve (before cost) chart...


What a surprise, a common strategy that losses quite a lot of money!  Suddenly the ever so famous phrase "more than meets the eye" come into my mind.  In fact I can't even test with seed capital below RM90K !   A sure way to learn about risk of ruin!  If you look closely, the account has already blown up with the huge unrealised loss!  Ever wonder why people lose money trading purely on RSI using common strategy recommended by brokers, trading websites, books and seminars?

In my following post, I will try to find justice for this indicator by either using it as filters or optimize the parameters and see if I could get a robust and working trading system out of it.

Disclaimer: Taken from CFTC RULE 4.41 – HYPOTHETICAL OR SIMULATED PERFORMANCE RESULTS HAVE CERTAIN LIMITATIONS. UNLIKE AN ACTUAL PERFORMANCE RECORD, SIMULATED RESULTS DO NOT REPRESENT ACTUAL TRADING. ALSO, SINCE THE TRADES HAVE NOT BEEN EXECUTED, THE RESULTS MAY HAVE UNDER OR OVER COMPENSATED FOR THE IMPACT, IF ANY, OF CERTAIN MARKET FACTORS, SUCH AS LACK OF LIQUIDITY. SIMULATED TRADING PROGRAMS IN GENERAL ARE ALSO SUBJECT TO THE FACT THAT THEY ARE DESIGNED WITH THE BENEFIT OF HINDSIGHT. NO REPRESENTATION IS BEING MADE THAT ANY ACCOUNT WILL OR IS LIKELY TO ACHIEVE PROFIT OR LOSSES SIMILAR TO THOSE SHOWN.

AND

WHATEVER YOU READ HERE SHOULD BE USED AS LEARNING AIDS ONLY AND SHOULD NOT BE CONSTRUED AS INVESTMENT ADVICE. IF YOU DECIDE TO INVEST REAL MONEY, ALL TRADING DECISIONS ARE YOUR OWN RESPONSIBILITY.

Monday, September 28, 2009

Turtle, any one?

     
Stay tuned, the turtles will be on the chopping block next...or maybe RSI...or Slow Stochastics...
    

3/7 EMA?

     
I get quite a lot of die hard fans of EMA 3/7 telling me how many hundreds of percent they have made in a short period of time.  Yes, you know who you are, don't be shy to admit! 

I'll post the backtested result here for your reference and feel free to correct me if I am wrong.  I know the die hard fans will claim that they are trading intraday, my advice?  Good luck!  You'll definitely need it.  To be fair, it is still a profitable system albeit a mediocre one, provided that your commissions and slippage is extremely low.

Here it goes...(Backtested parameters: Bursa FKLI EOD Jan 1996- Sep 2009, Stop-and-Reverse with basic 1 contract)


And as usual....
Disclaimer: Taken from CFTC RULE 4.41 – HYPOTHETICAL OR SIMULATED PERFORMANCE RESULTS HAVE CERTAIN LIMITATIONS. UNLIKE AN ACTUAL PERFORMANCE RECORD, SIMULATED RESULTS DO NOT REPRESENT ACTUAL TRADING. ALSO, SINCE THE TRADES HAVE NOT BEEN EXECUTED, THE RESULTS MAY HAVE UNDER OR OVER COMPENSATED FOR THE IMPACT, IF ANY, OF CERTAIN MARKET FACTORS, SUCH AS LACK OF LIQUIDITY. SIMULATED TRADING PROGRAMS IN GENERAL ARE ALSO SUBJECT TO THE FACT THAT THEY ARE DESIGNED WITH THE BENEFIT OF HINDSIGHT. NO REPRESENTATION IS BEING MADE THAT ANY ACCOUNT WILL OR IS LIKELY TO ACHIEVE PROFIT OR LOSSES SIMILAR TO THOSE SHOWN.

AND

WHATEVER YOU READ HERE SHOULD BE USED AS LEARNING AIDS ONLY AND SHOULD NOT BE CONSTRUED AS INVESTMENT ADVICE. IF YOU DECIDE TO INVEST REAL MONEY, ALL TRADING DECISIONS ARE YOUR OWN RESPONSIBILITY.
       

What About EMA 3/30 ?

    
My brother wants to know the backtest performance summary for EMA 3/30 crossover.  Here is the result brother. 


And the equity curve (before cost) chart...


This is a Stop-and-Reverse (SAR) system trading 1 contract on Bursa FKLI (continuous front-month EOD data) from Jan 1996 - Sep 2009.  When the EMA 3(closed) crosses above EMA 30 (closed) the system would go Long 1 contract on next-day open and turn Short on next-day open when the EMA 3 (closed) crosses below EMA 30 (closed).

Happy trading brother!

And as usual....

Disclaimer: Taken from CFTC RULE 4.41 – HYPOTHETICAL OR SIMULATED PERFORMANCE RESULTS HAVE CERTAIN LIMITATIONS. UNLIKE AN ACTUAL PERFORMANCE RECORD, SIMULATED RESULTS DO NOT REPRESENT ACTUAL TRADING. ALSO, SINCE THE TRADES HAVE NOT BEEN EXECUTED, THE RESULTS MAY HAVE UNDER OR OVER COMPENSATED FOR THE IMPACT, IF ANY, OF CERTAIN MARKET FACTORS, SUCH AS LACK OF LIQUIDITY. SIMULATED TRADING PROGRAMS IN GENERAL ARE ALSO SUBJECT TO THE FACT THAT THEY ARE DESIGNED WITH THE BENEFIT OF HINDSIGHT. NO REPRESENTATION IS BEING MADE THAT ANY ACCOUNT WILL OR IS LIKELY TO ACHIEVE PROFIT OR LOSSES SIMILAR TO THOSE SHOWN.

AND

WHATEVER YOU READ HERE SHOULD BE USED AS LEARNING AIDS ONLY AND SHOULD NOT BE CONSTRUED AS INVESTMENT ADVICE. IF YOU DECIDE TO INVEST REAL MONEY, ALL TRADING DECISIONS ARE YOUR OWN RESPONSIBILITY.
      

The Effects of Adding Filters in Designing a Robust Trading System - MACD - Continue

Before I start adding filters, I would like to touch on a controversial subject in designing and testing trading systems, that is Optimization. 

Why can't I just change the parameters of MACD that I used?  For example keep changing the period used in MACD from (12,26,9) to (19,40,9) with increment 1 each time then compare the performance summary and try to get the best result.  Then plot a heat-map and choose the best parameters.  A lot of famous authors call this process optimization.  Some argue that it is curve-fitting. 

In my opinion they are both correct, optimization is a form of curve-fitting.  When you over do it, it become more and more curve-fitting but when you do it just right (that's why it is still an art), you are just trying to get the parameters that reflected better on the signature of the market you are testing as each market has different types of players and the underlying product is also different.

When you do optimization, pay extra attention to the results from neighbouring numbers, you have to be extra careful e.g. when SMA 10/20 and SMA 12/20 are losing money but your SMA 11/20 produces great numbers.

The easiest way to tell that a trading system is over curve-fitting is by looking at the number of indicators used.  A robust trading system should be simple but no simpler. As a rule of thumb, if it has more than 5-6 indicators usually it is a sign of over curve-fitting already as you may be trying to catch every top and bottom in the chart that you are looking at.  Just be honest with your out-sample testing result!

OK, enough talk, lets get back to adding filters to our MACD system.  Since the FKLI market is an equity index-based and the underlying is actually tracking a baskets of stocks, and by and large stocks over a long period of time (e.g. 10 years) are bullish bias, we can try adding a faster SMA period to go Long and a slower period to confirm the Short so as to cut down unnecessary whipsaws.  I would test with SMA 20 as a filter to go Long and SMA 50 as a filter for Short.

That means the system will go Long when the MACD line crosses above signal line AND the closing price is above SMA 20 (closed).  It will turn Short only when the MACD(12,26,9) line crosses below the signal line AND the closing price is below SMA 50(closed).

Lets take a look at the result...


And the equity chart (before cost)...


The result is much better comparing with the one before we add the filters.  We have also cut down a lot of unnecessary trades.  To be more sure (we can't really be 100% sure anyway) adding filters does have effect, we actually have to do the statistical significance test (null hypothesis test) which I won't discuss here as it is a big and heavy subject on its own!  However, you can learn on your own, just google "inferential statistics" or "descriptive statistics".

Good luck in systems building and testing.

Disclaimer: Taken from CFTC RULE 4.41 – HYPOTHETICAL OR SIMULATED PERFORMANCE RESULTS HAVE CERTAIN LIMITATIONS. UNLIKE AN ACTUAL PERFORMANCE RECORD, SIMULATED RESULTS DO NOT REPRESENT ACTUAL TRADING. ALSO, SINCE THE TRADES HAVE NOT BEEN EXECUTED, THE RESULTS MAY HAVE UNDER OR OVER COMPENSATED FOR THE IMPACT, IF ANY, OF CERTAIN MARKET FACTORS, SUCH AS LACK OF LIQUIDITY. SIMULATED TRADING PROGRAMS IN GENERAL ARE ALSO SUBJECT TO THE FACT THAT THEY ARE DESIGNED WITH THE BENEFIT OF HINDSIGHT. NO REPRESENTATION IS BEING MADE THAT ANY ACCOUNT WILL OR IS LIKELY TO ACHIEVE PROFIT OR LOSSES SIMILAR TO THOSE SHOWN.

AND

WHATEVER YOU READ HERE SHOULD BE USED AS LEARNING AIDS ONLY AND SHOULD NOT BE CONSTRUED AS INVESTMENT ADVICE. IF YOU DECIDE TO INVEST REAL MONEY, ALL TRADING DECISIONS ARE YOUR OWN RESPONSIBILITY.


Sunday, September 27, 2009

The Effects of Adding Filters in Designing a Robust Trading System - MACD

Here, I would just like to test the usefulness of adding filters in a trading system.  As usual, before designing any trading system, we'll have to at least make sure that the underlying strategies make sense to us.  In this example, I would like to test the profitability of using a very famous momentum-based oscillator called MACD and backtest the system on FKLI index futures from 1996-2009.  After that I would try to add a SMA filter and see if it would improve the performance of the trading system.

The MACD is a relatively short-term momentum indicator and the positive or negative divergence is easy to program in excel and therefore can be easily tested.  The reason I want to test this is because from a daily chart observation, it looks like a very profitable strategy going Long when the MACD line crossover above the signal line and going Short when the MACD line crossover below the signal line.  For the test, I'll go Long on next-day market open when we have a positive divergence (MACD line crossover above the signal line) and turn Short on next-day market open when there is a negative divergence (MACD line crossover below the signal line).  It is a Stop-and-Reverse system.  I will be using the default setting of MACD(12,26,9) and a daily closed of FKLI from Jan 1996 until August 2009(continuous front-month data) trading basic 1 contract.  If you want to know more detail about MACD, you can read Gerald Appel's (the inventor of MACD) book title "Technical Analysis - Power Tools for Active Investors".

And here is the trading system's performance summary report before adding any filters.


This is another case of observational bias in trading (a lot of traders fall into this category).  Things that look good on a few occurances (minutes, hours, days, weeks or months of observation) when put under statistical long-term test yield a different result, and quite often a disappointment!  To be fair, the system actually is profitable before adding in the cost of trading and slippage + rolls.  Again, that is why a lot of system sellers are unrealistics in giving you the backtested trading performance summary without adding the actual cost and skid of trading!  Be very careful when you read those system performance summary.

To add salt to the wound, we have to remember that very often the performance of a good and robust trading system will degrade overtime!  So we can't fool ourselves that it will perform better in the future. 

In the next post, I will add in a SMA as a filter and see if we can improve the system's profitability.  Until then...

Disclaimer: Taken from CFTC RULE 4.41 – HYPOTHETICAL OR SIMULATED PERFORMANCE RESULTS HAVE CERTAIN LIMITATIONS. UNLIKE AN ACTUAL PERFORMANCE RECORD, SIMULATED RESULTS DO NOT REPRESENT ACTUAL TRADING. ALSO, SINCE THE TRADES HAVE NOT BEEN EXECUTED, THE RESULTS MAY HAVE UNDER OR OVER COMPENSATED FOR THE IMPACT, IF ANY, OF CERTAIN MARKET FACTORS, SUCH AS LACK OF LIQUIDITY. SIMULATED TRADING PROGRAMS IN GENERAL ARE ALSO SUBJECT TO THE FACT THAT THEY ARE DESIGNED WITH THE BENEFIT OF HINDSIGHT. NO REPRESENTATION IS BEING MADE THAT ANY ACCOUNT WILL OR IS LIKELY TO ACHIEVE PROFIT OR LOSSES SIMILAR TO THOSE SHOWN.

AND


WHATEVER YOU READ HERE SHOULD BE USED AS LEARNING AIDS ONLY AND SHOULD NOT BE CONSTRUED AS INVESTMENT ADVICE. IF YOU DECIDE TO INVEST REAL MONEY, ALL TRADING DECISIONS ARE YOUR OWN RESPONSIBILITY.


Friday, September 25, 2009

Equity Curve Chart


And here goes the sample equity curve chart for the fixed ratio MM performance summary that I have just posted.


With Fixed Ratio Money Management


Here you can really see the difference in performance when appropriate money management rules are added.


I choose (of personal taste) Fixed Ratio MM from the author of the book "The Trading Game - playing by the numbers to make Millions" by Ryan Jones instead of Fixed Fractional MM made popular by Ralph Vince in his book "The mathematics of Money management - risk analysis techniques for traders". You can find out the reasons for choosing fixed ratio over fixed fractional in his book, I don't wish to discuss here.

Equity Curve Chart


And here is the equity curve chart for the SMA 10/50 (daily closed) FKLI trend-following sample system that I have just posted.


Awaken from Hibernation


Didn't update the blog for quite some time. Have been taking my own sweet time to improve on my backtesting system on MS Excel. It has been quite a challenge trying to design and implement a backtesting system that I can at least show it to people who knows their stuff.


Some major things that finally my backtesting system can do:


1) Separate Long trades and Short Trades (earlier system was a SAR-Stop-and-Reverse only system) and get their trade statistics for e.g. % of winning long trades v.s % of winning short trades, average winning long trades v.s average winning short trades etc


2) Each direction of trade e.g Long trades can have different parameters for stop-loss and profit-exit. Example: I can have a Donchian style 20 period breakout above for going Long with 2ATR(Average True Range) for stop-loss and 18 period exit and 22 period for going Short with 1.5ATR for stop-loss and 18 period exit. I know a bit overkill at times and must be careful to avoid situations where parameters for going Short is earlier than Long exit, no meaning if you are trading a single account. How do you turn Short while holding Long ?


3) Probability that your maximum intraday unrealised loss would not reach a certain amount. Example I can now know that 99% of the time my open positions should not have reach 60 pts for FKLI if I am trading a trend following system based on SMA 10/50(daily) crossover system.


4) Probability that my maximum intraday unrealised profit should reach. For example using system above, I can tell that 50% of the time I can expect maximum intraday profit of 69 pts.


5) Fixed Fractional Money Management or Fixed Ratio Money Management


And many other little tweaks and improvements.


Enough talk for now. I will leave you all with a sample trading system (above) and its performance summary backtested over 13 years using Bursa Malaysia's FKLI spot-month continuous contract. Please remember: Always verify the performance summary on your own.

AND

Disclaimer: Taken from CFTC RULE 4.41 – HYPOTHETICAL OR SIMULATED PERFORMANCE RESULTS HAVE CERTAIN LIMITATIONS. UNLIKE AN ACTUAL PERFORMANCE RECORD, SIMULATED RESULTS DO NOT REPRESENT ACTUAL TRADING. ALSO, SINCE THE TRADES HAVE NOT BEEN EXECUTED, THE RESULTS MAY HAVE UNDER OR OVER COMPENSATED FOR THE IMPACT, IF ANY, OF CERTAIN MARKET FACTORS, SUCH AS LACK OF LIQUIDITY. SIMULATED TRADING PROGRAMS IN GENERAL ARE ALSO SUBJECT TO THE FACT THAT THEY ARE DESIGNED WITH THE BENEFIT OF HINDSIGHT. NO REPRESENTATION IS BEING MADE THAT ANY ACCOUNT WILL OR IS LIKELY TO ACHIEVE PROFIT OR LOSSES SIMILAR TO THOSE SHOWN.

AND

WHATEVER YOU READ HERE SHOULD BE USED AS LEARNING AIDS ONLY AND SHOULD NOT BE CONSTRUED AS INVESTMENT ADVICE. IF YOU DECIDE TO INVEST REAL MONEY, ALL TRADING DECISIONS ARE YOUR OWN RESPONSIBILITY.